Suppliers
Suppliers are the subcontractors — sometimes called 3PT (third-party transport) — who carry out collections on your behalf. This screen is where you track what you spend with each one, how much margin their work earns you, and the rates you buy and sell that work at.
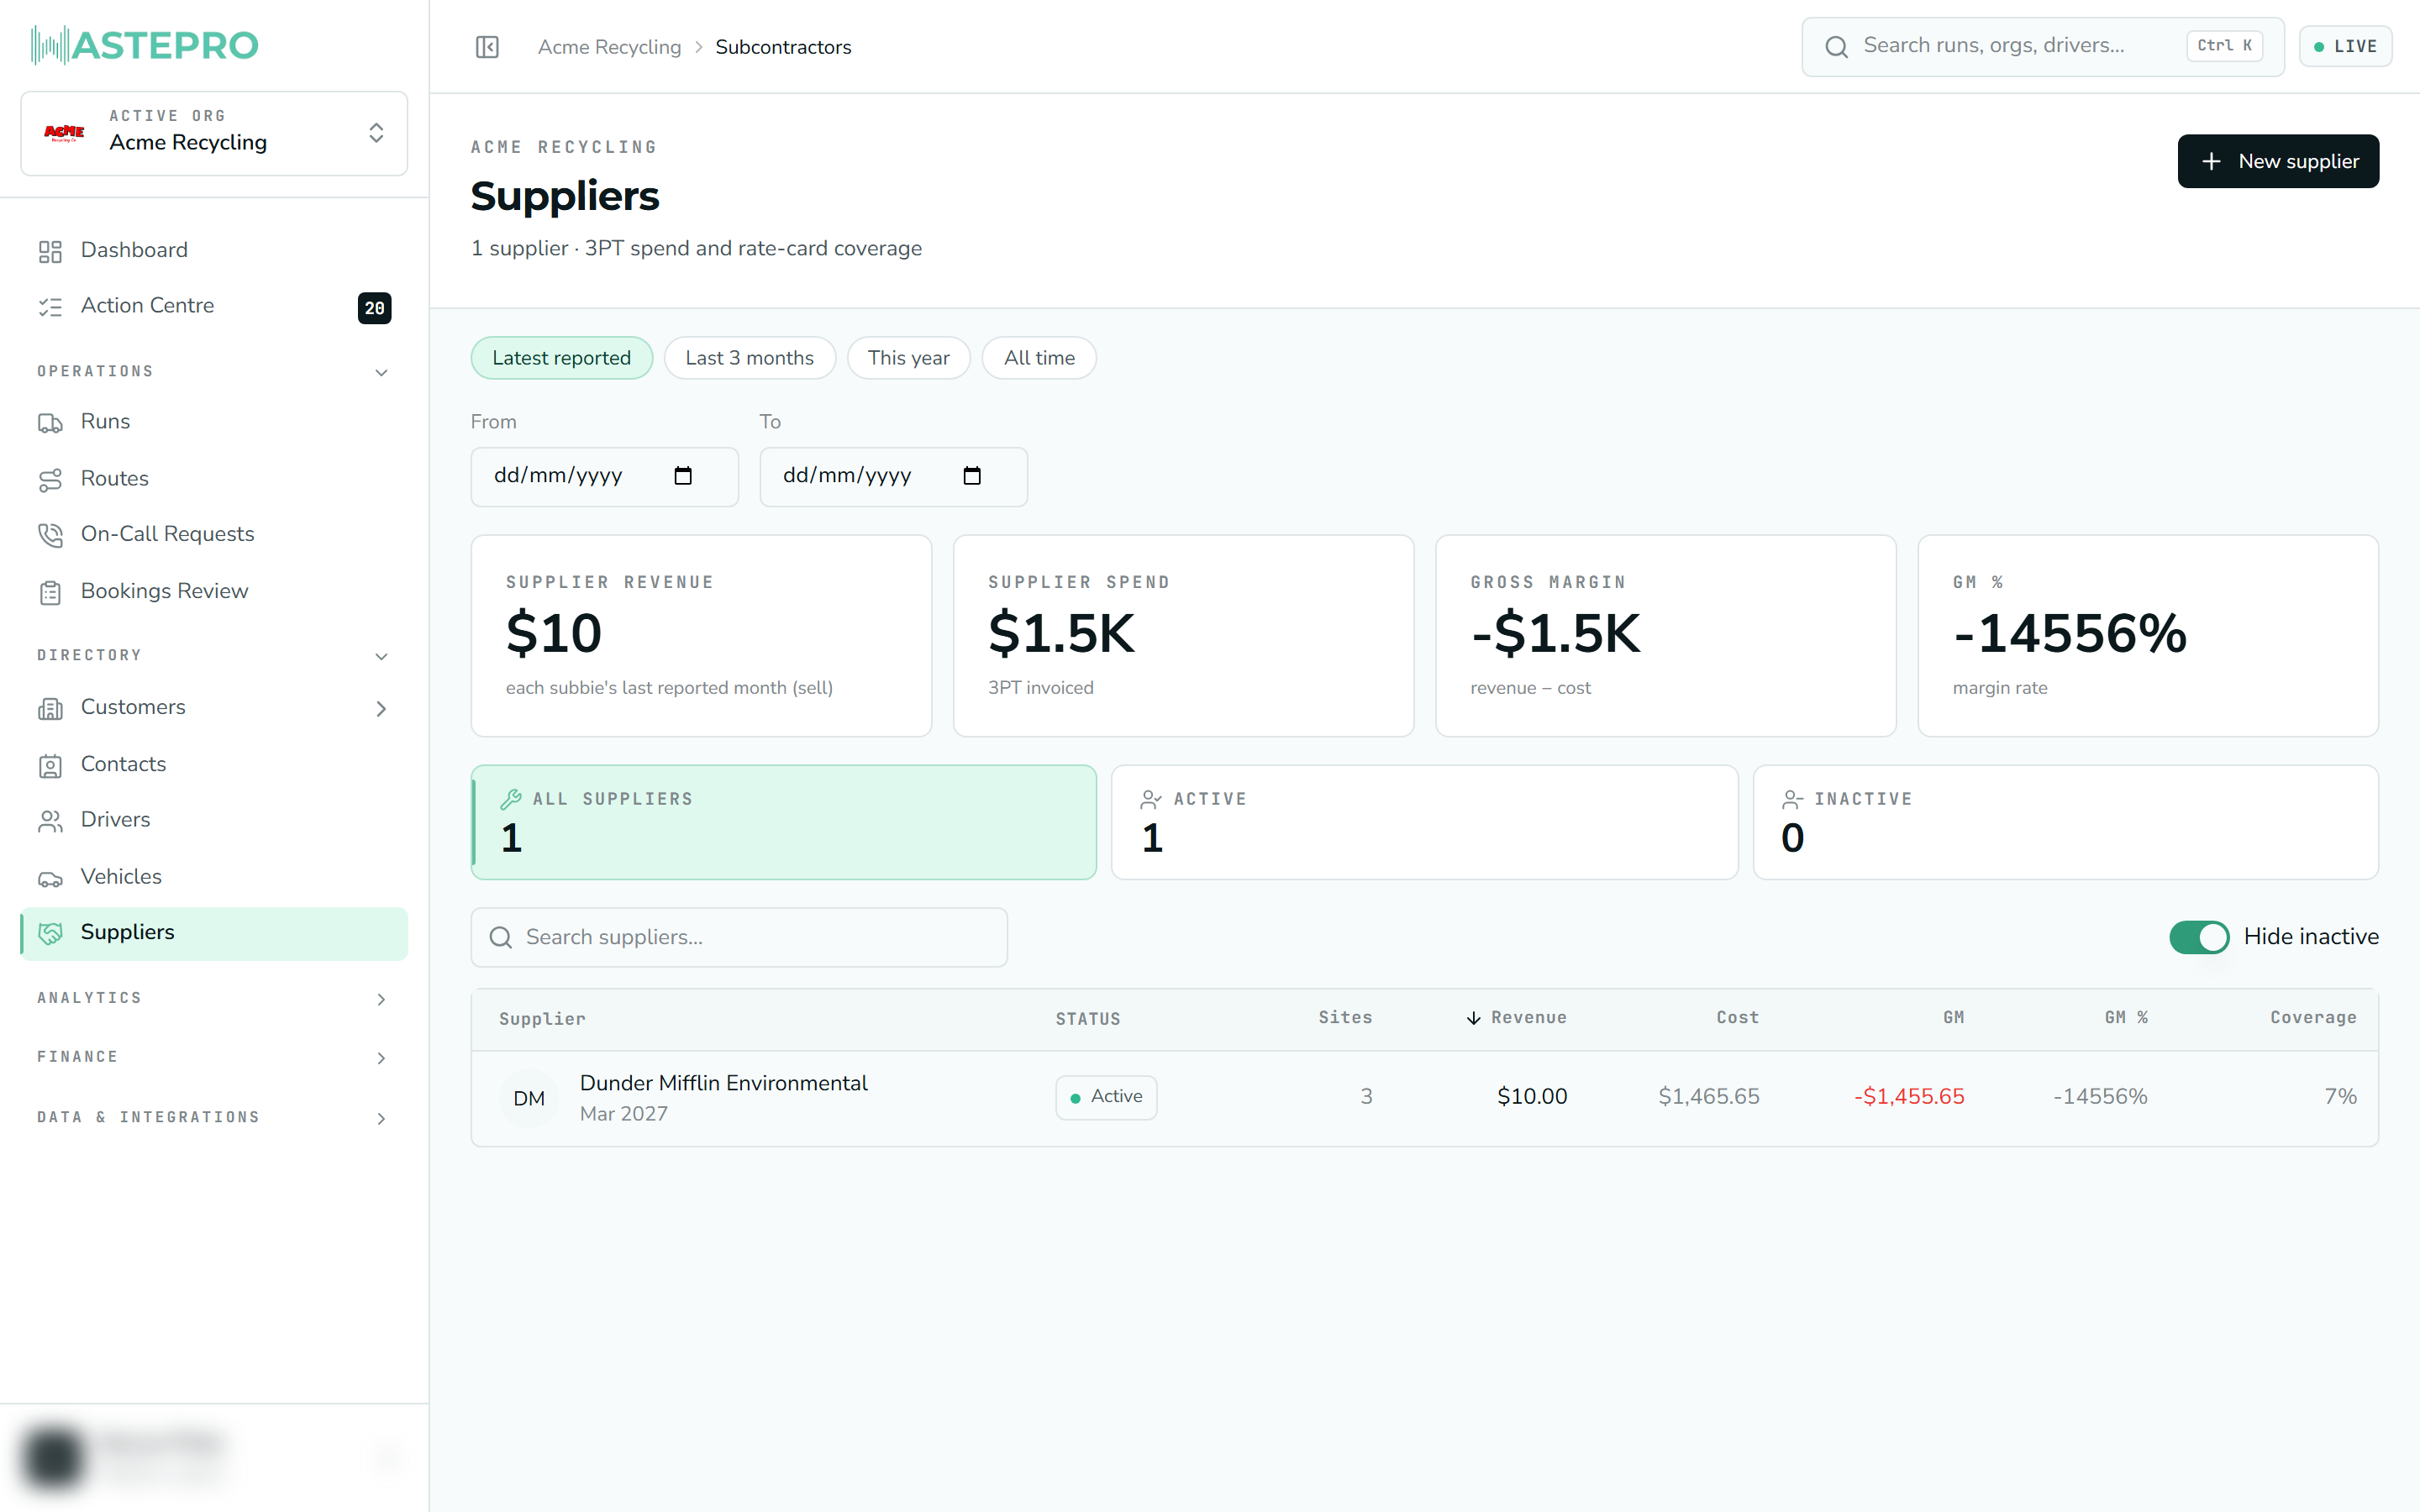
The menu label is Suppliers, but you’ll still see the word subcontractor
in a few places (and the web address is /subcontractors). They mean the same
thing — an external company that does collections for you.
What the list is for
The Suppliers screen is part directory, part scorecard. As well as listing who your suppliers are, it pulls in the commercials from your 3PT data so you can see, per supplier: how much revenue their sites bring in, what they cost you, and the gross margin (and margin %) that leaves.
Because those figures are period-based, a date control at the top lets you choose the window — a specific month, a custom range, or all time. Four headline tiles above the list total the visible suppliers’ revenue, spend, gross margin and GM % for that window.
If you’re new to WastePro or haven’t uploaded any 3PT data yet, the money columns will be blank. That’s not a fault — those figures come from your subcontractor activity once it’s loaded in.
The supplier list
Below the headline tiles, status tiles count your suppliers (all, active, inactive), and a search box lets you find one by name. The table ranks suppliers — by revenue by default — and you can sort by any column:
| Column | What it shows |
|---|---|
| Supplier | Name and photo, with the month the figures are from |
| Status | Active or Inactive |
| Sites | How many sites this supplier services |
| Revenue | What their work billed for in the period |
| Cost | What they charged you (3PT invoiced) |
| GM | Gross margin — revenue minus cost |
| GM % | Margin as a percentage of revenue |
| Coverage | How much of their activity is covered by a rate card |
Coverage is worth watching: it tells you how much of a supplier’s work has proper buy/sell rates set up, versus work that’s still unpriced. Low coverage means margin figures are only part of the picture.
To add a supplier, select New supplier, enter the company or operator name, set the status, and save.
The supplier detail screen
Clicking a supplier opens their hub. A date control and a set of headline figures (revenue, cost, gross margin and site count for the chosen period) sit at the top, and the detail is split across four tabs:
Overview
Month-by-month performance — revenue, cost and margin — plus that supplier’s top sites ranked by gross margin.
Rate card
The heart of pricing. For each site, it builds up the margin from every charge component — lift, container rental, heavy-bin, transport, disposal — at your buy and sell rates against real volumes. Edit a rate to model where a site’s margin lands; edits are logged.
Sites
Every site this supplier services, with revenue, cost and margin per site for the selected period. Users with the right permission can add a site to the supplier here.
Activity
Throughput and commercials by month together — jobs, volume and weight alongside revenue, cost and margin.
The revenue, cost and margin figures come from your uploaded 3PT data, and they’re period-based — change the date control and the numbers change with it. If a supplier looks like it has no activity, check the period first.
Next: to dig into subcontracted profitability across all suppliers at once, see Brokerage analysis.