KPIs & Reviews
WastePro holds a set of ready-made reports for reviewing how the operation is running — volumes, subcontractor activity, and the exceptions worth chasing. This page is a quick tour of the ones you’ll reach for most, so you know which one answers which question.
They’re spread across three groups under Analytics: Customer Analysis, KPIs and Reviews, plus Supplier Analysis under Brokerage (3PT). The table below says which is where.
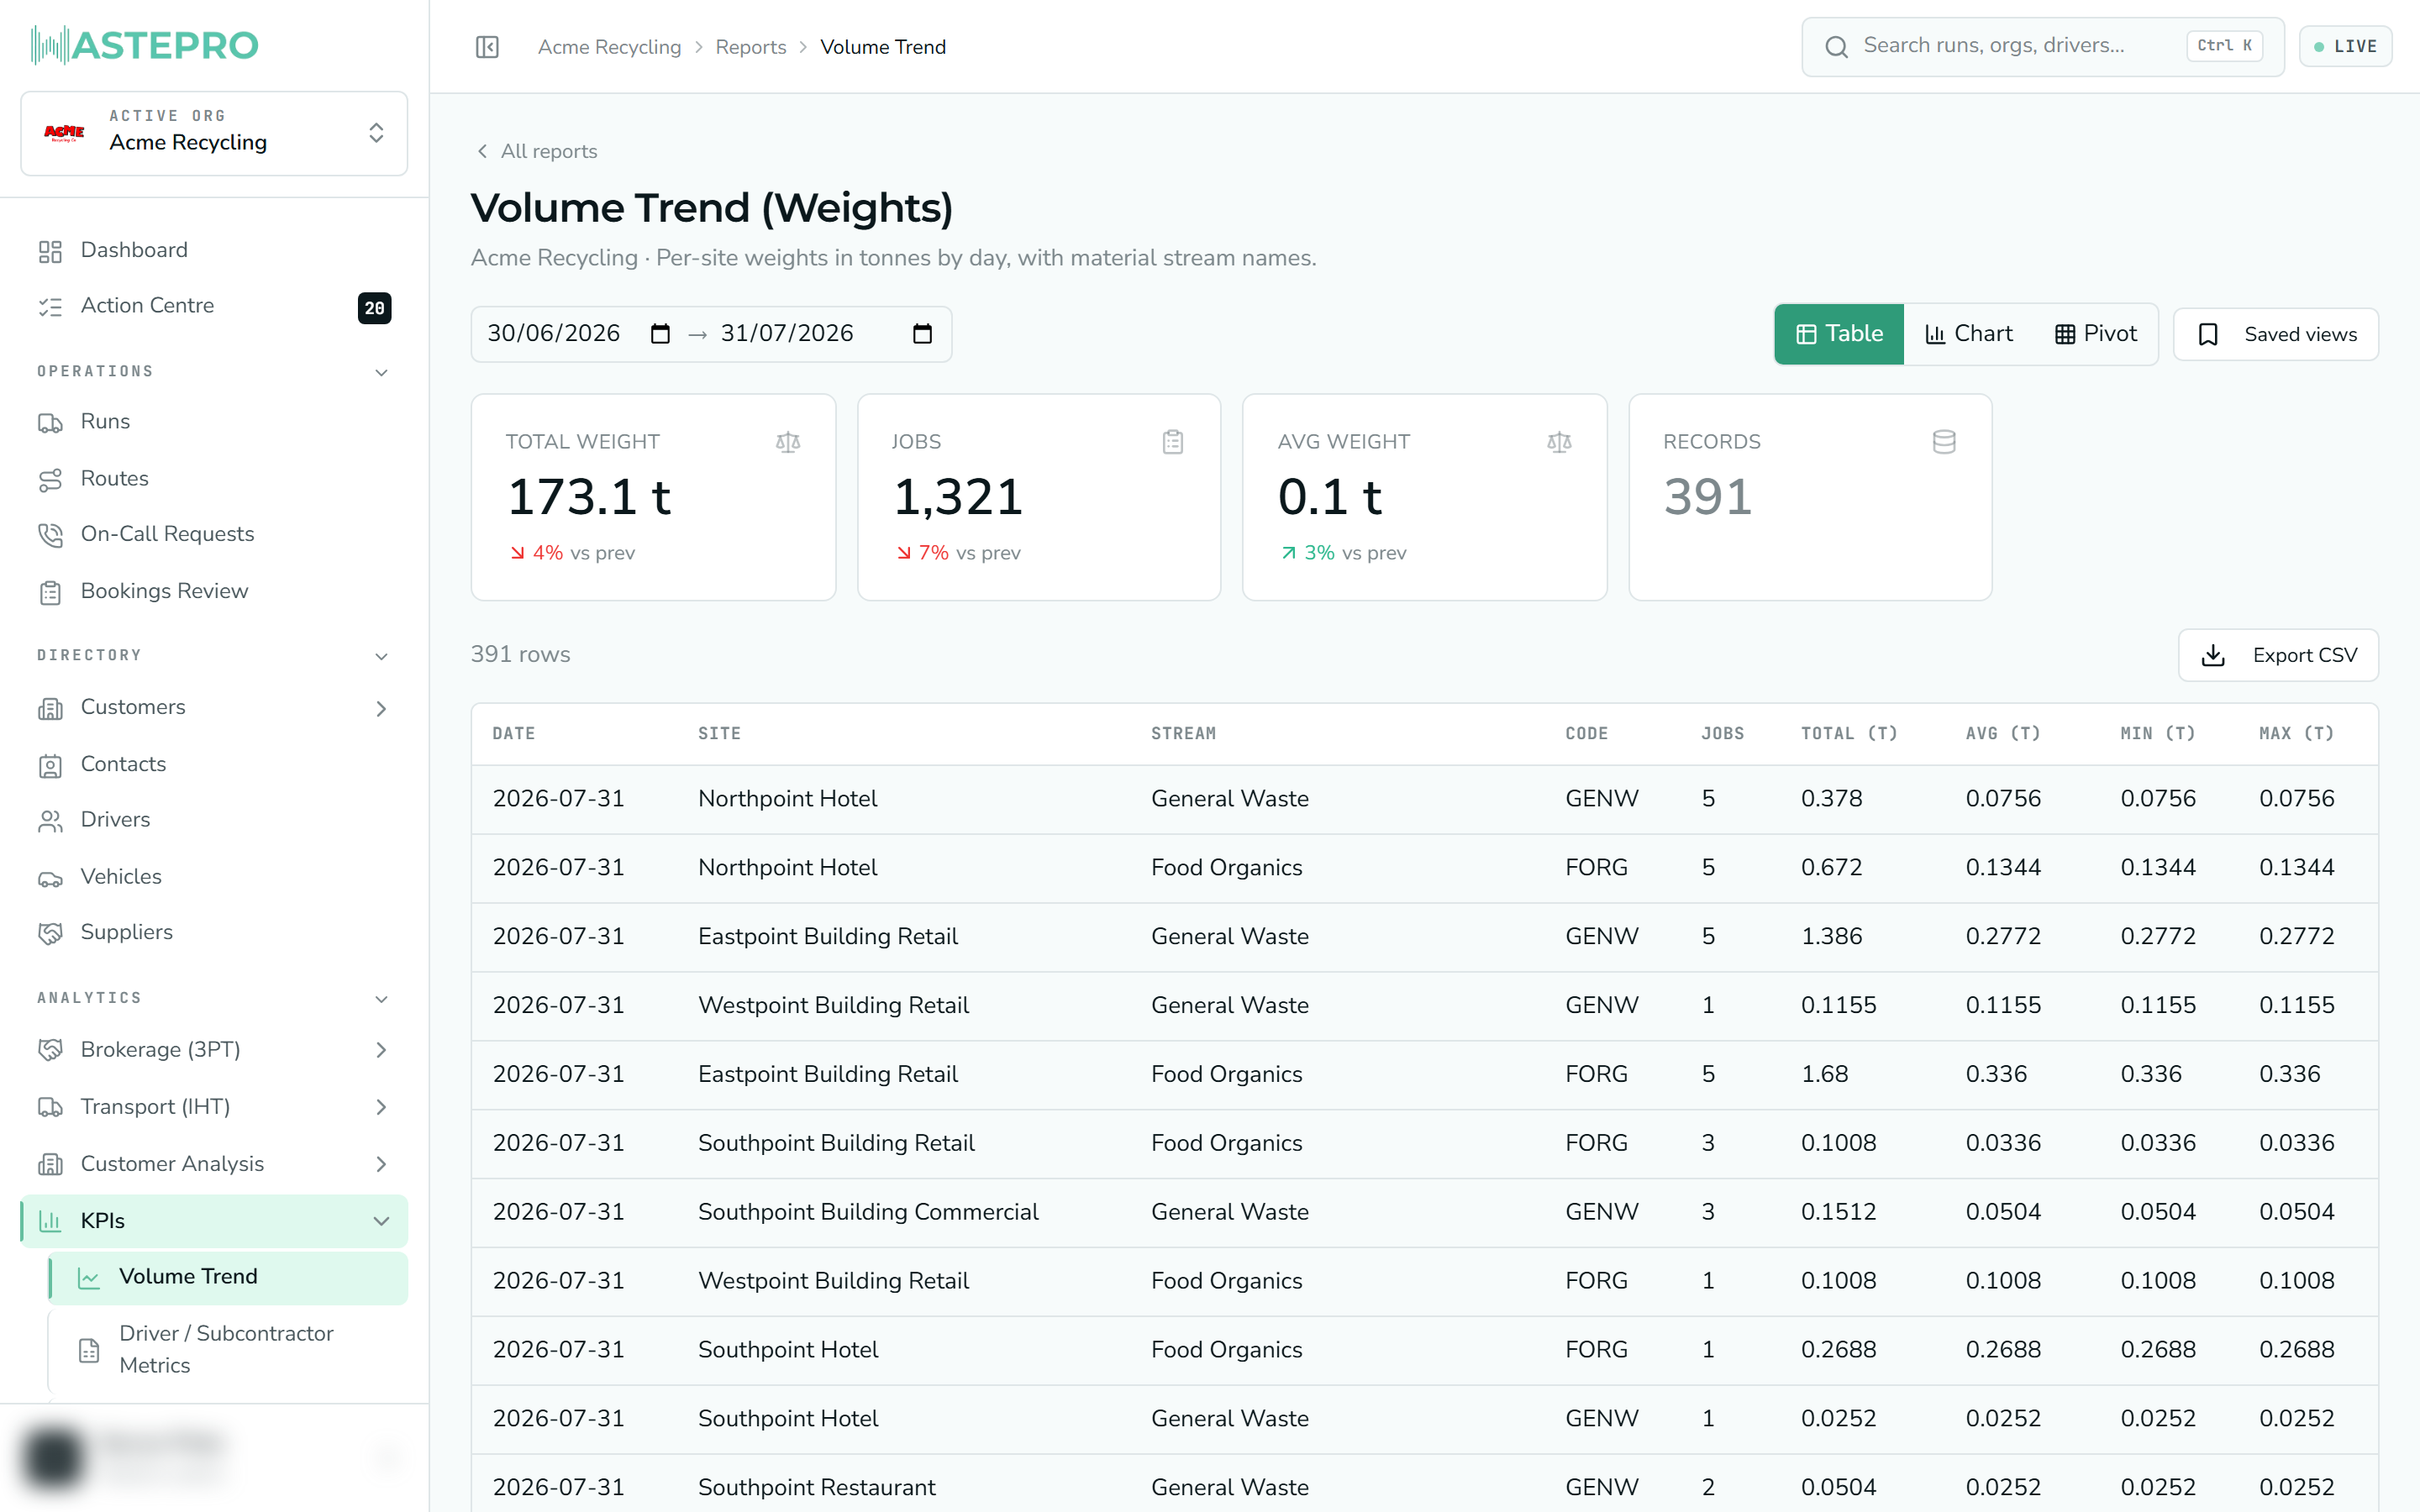
Every report shares the same controls — date range, grouping, table / chart / pivot views, KPI tiles and export. Rather than repeat them here, see How reports work for how to drive any report. Below is just what each one shows and when to look at it.
The reports
| Report | Where | What it shows | When to look at it |
|---|---|---|---|
| Site / Customer Metrics by Day | Customer Analysis | Daily volume, weight and job counts for each site and customer, down to container and stream. | To review a single customer or site closely, or compare sites against each other. |
| Volume Trend (Weights) | KPIs | Weight collected (in tonnes) per site over time, broken down by material stream, with totals, averages, and daily highs and lows. | To see how much material each site is generating and spot a site trending up or down. |
| Driver / Subcontractor Metrics by Month | KPIs | Monthly job counts, volume and weight grouped by subcontractor and site. | To review how much work each subcontractor did, month by month. |
| Job Metrics by Month | KPIs | Monthly totals — job counts, quantity, volume and weight — across your models, systems, material streams and job types. | For a high-level, month-by-month picture of operational volume for the whole business. |
| Futile Jobs | Reviews | Every futile (failed) collection, with its reason code, site and material stream. | To find recurring access or presentation problems and follow up with customers. |
| Contamination | Reviews | Every contaminated collection, by site, material stream and container. | To pinpoint sites with recurring contamination and act before it becomes costly. |
| Supplier Analysis | Brokerage (3PT) | Subcontractor collection volume by site, stream and container, laid out month by month. | To scan brokered volumes across suppliers and spot month-to-month shifts. |
Each report opens on a sensible default date range (some look back a month, others up to a year) which you can change at the top.
There’s one more that isn’t on the menu: Driver Productivity by Run, at
/reports/driver-run, which breaks a driver’s figures down run by run. The fuller
Driver Productivity screen covers the same ground and
lets you expand a driver to see their runs, so reach for that one first.
Two terms worth defining
A couple of these reports use words that have a specific meaning in waste collection:
- Futile — an attempted collection that couldn’t be completed. The truck went out, but the bin couldn’t be serviced — it was blocked, not put out, the gate was locked, the bin was contaminated, and so on. Each futile job is recorded with a reason code so you can see why it failed, not just that it failed.
- Contamination — the wrong material in a bin: general waste in a recycling bin, or the wrong recyclable in a stream. It matters because a contaminated load can be downgraded, rejected, or attract a charge — so recurring contamination at a site is worth catching early.
Both the Futile Jobs and Contamination reports are really review lists: they give you the individual jobs behind the numbers so you can group by site or reason, find the repeat offenders, and have a specific conversation with the customer.
These reports are read-only — they’re for reviewing and exporting, not editing. Their KPI tiles show exact totals for the range you’ve chosen. See How reports work for filtering, grouping and export.
Next: to review margin on your subcontracted work rather than volumes, see Brokerage / Subcontract analysis.