Assumption Base
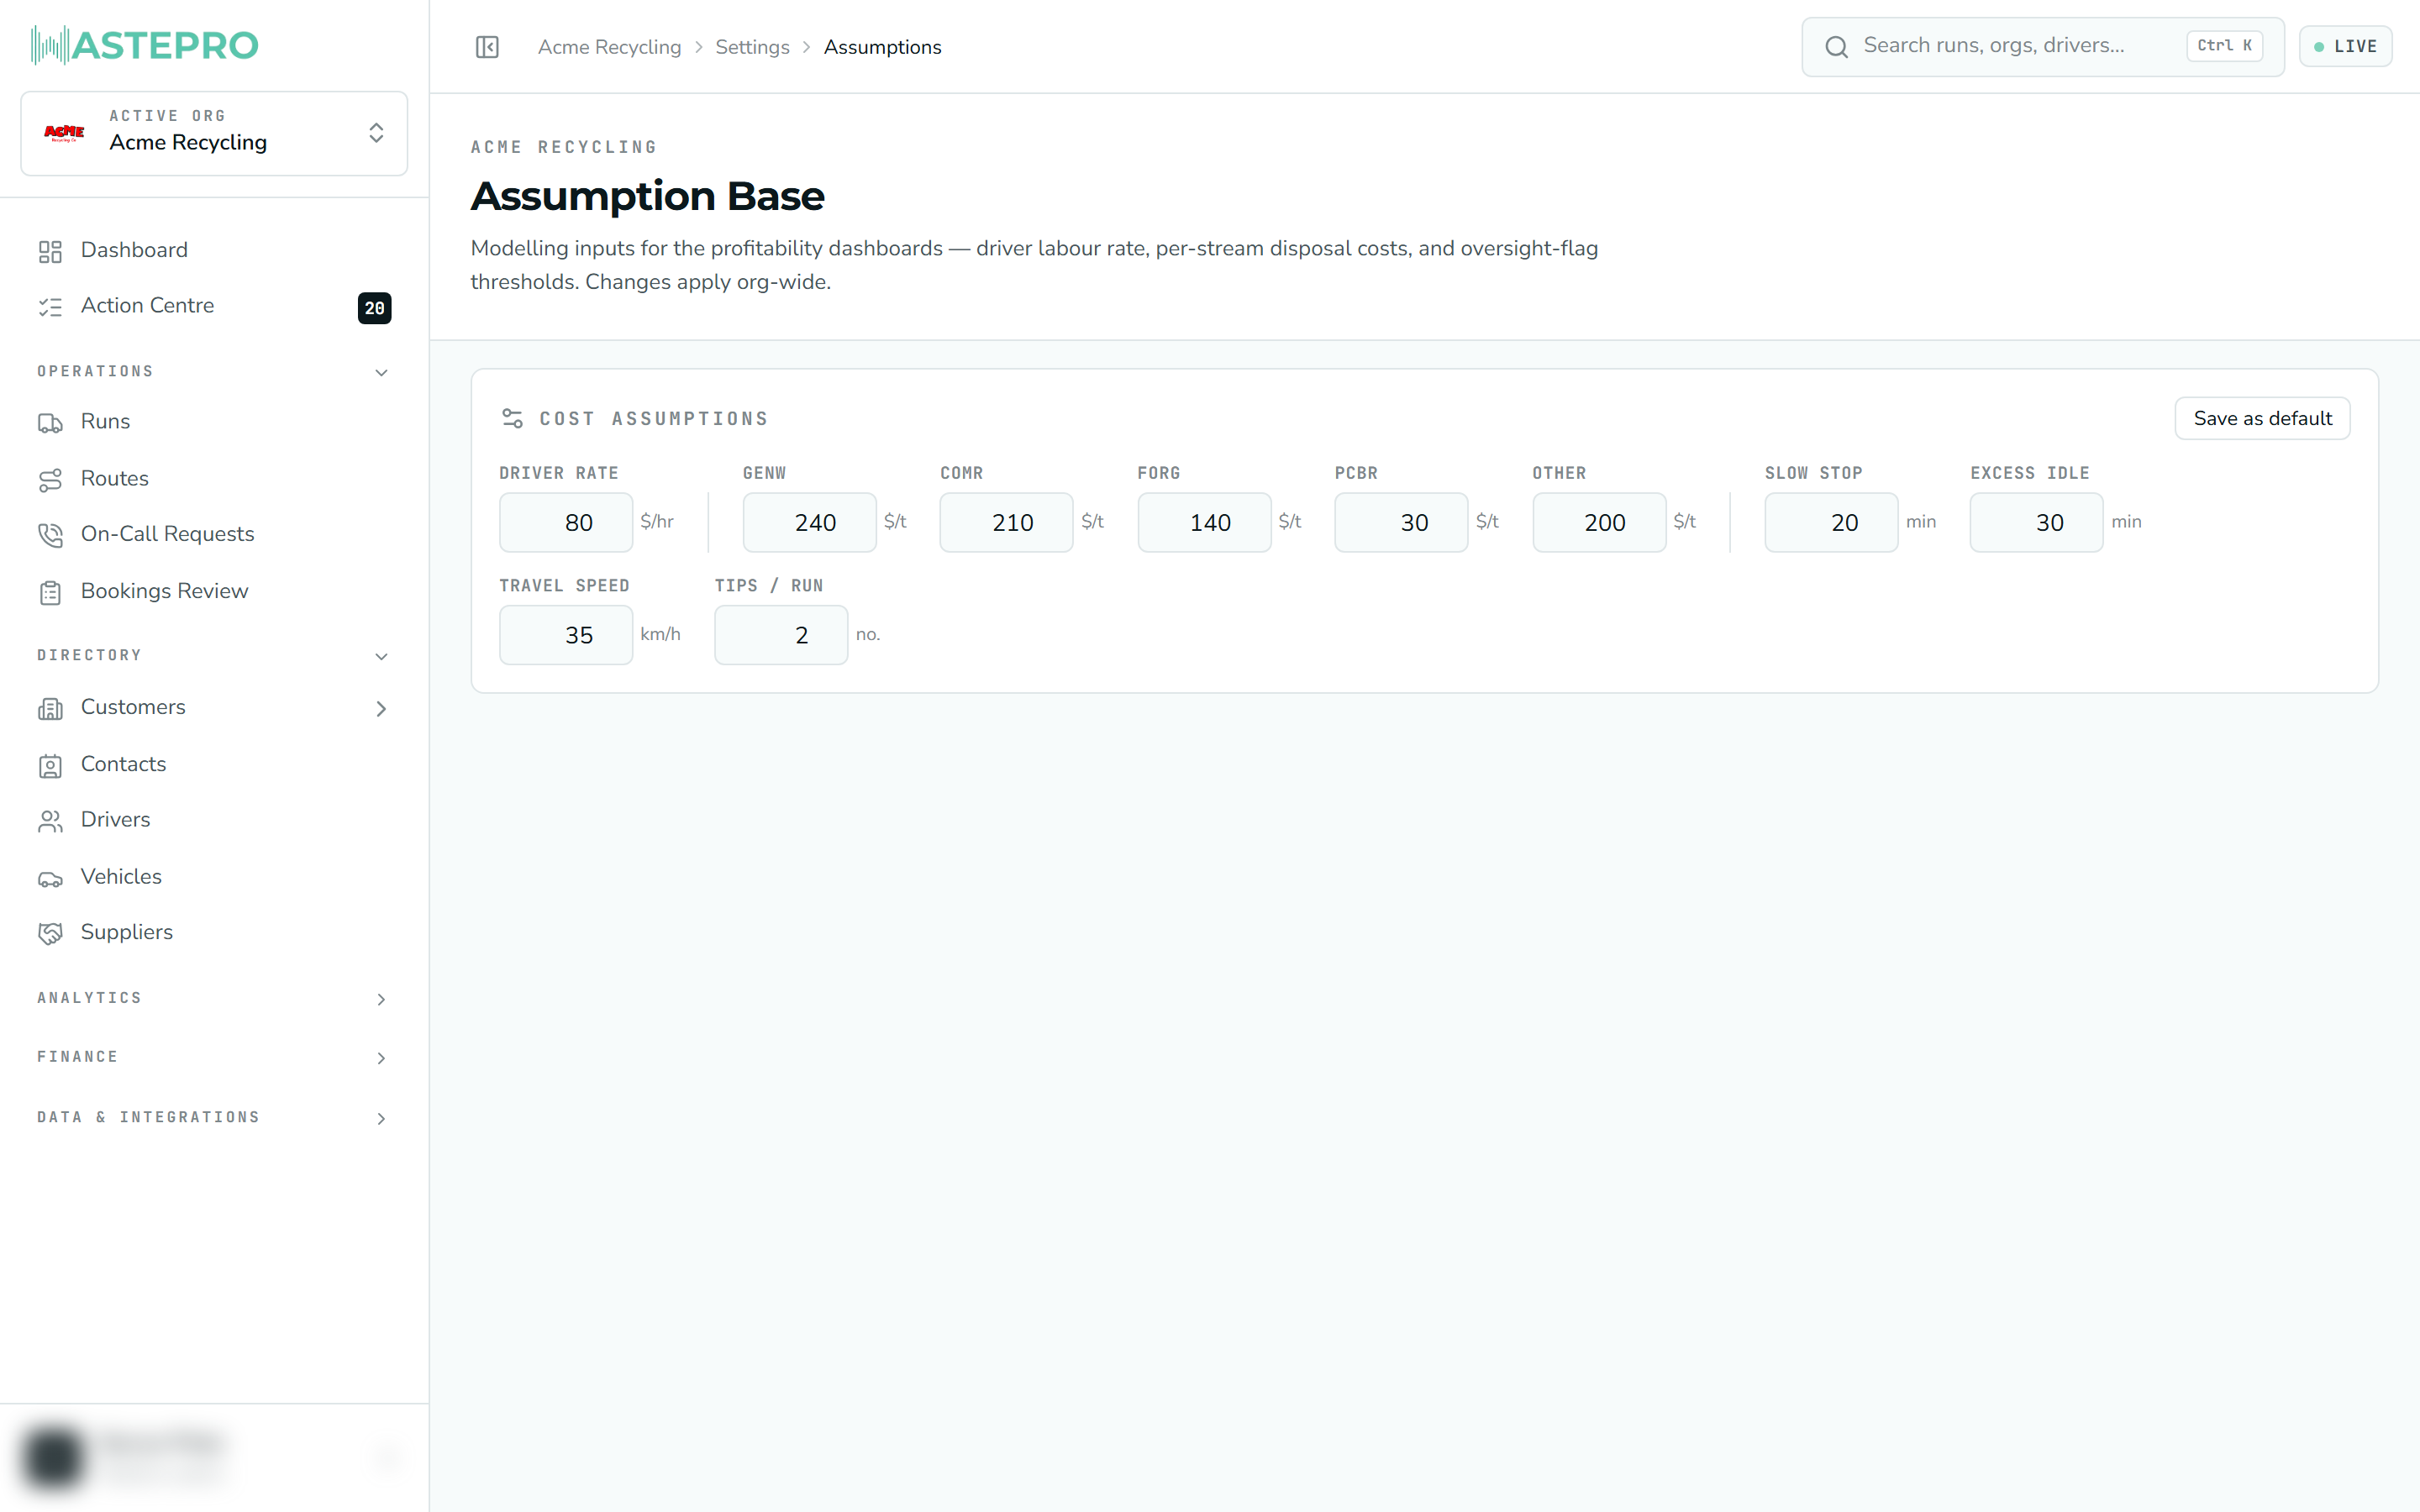
The Assumption Base is where you set the modelling inputs that WastePro uses to work out profitability and productivity in your reports — things like what a driver-hour costs and what it costs to dispose of a tonne of each waste stream. You’ll find it in the account menu at the bottom of the sidebar.
Why it matters
WastePro doesn’t know your true costs, so it uses the figures you enter here to estimate them. The profitability and driver-productivity reports read these values to calculate margins, cost per job, and which drivers to flag. Set them once, close to your real numbers, and the reports become far more meaningful.
These are modelling assumptions, not the prices you charge. Changing a disposal rate here changes what the reports show as your cost and profit — it does not change any customer’s invoice or the rates on your services. (Sell rates live on each service, not here.)
What you can set
The values are grouped across the panel. There’s one Save as default button that saves everything for the whole organisation.
| Input | Unit | What it means |
|---|---|---|
| Driver rate | $/hr | Your blended cost of a driver’s labour per hour. |
| Stream rates (GENW, COMR, FORG, PCBR, plus any others in your data) | $/t | What it costs you to dispose of a tonne of each waste stream. |
| Other | $/t | The disposal cost used for any stream that doesn’t have its own rate. |
Below the cost rates are the oversight thresholds — the rules that decide when a driver gets flagged for review on the productivity report:
| Threshold | Unit | What it flags |
|---|---|---|
| Slow stop | min | Flag a driver whose average time per stop is above this. |
| Excess idle | min | Flag unexplained idle time between stops above this. |
| Travel speed | km/h | The assumed driving speed used to estimate travel time (so long, necessary drives don’t get flagged as idling). |
| Tips / run | no. | How many trips to the tip a run normally includes, so genuine tip runs aren’t mistaken for idling. |
Saving your changes
Adjust the values
Type over any figure. As you edit, the reports that use these numbers recalculate live so you can see the effect.
Save as default
Click Save as default to store the values for your organisation. Until you save, your edits are just a preview — the saved defaults are what the reports use from then on.
Because everyone’s reports read the same saved assumptions, a change here affects the numbers your whole team sees. If margins in a report suddenly look different, a changed assumption is a good first thing to check.
Next: see how these inputs shape the reports in Driver productivity.