Master List
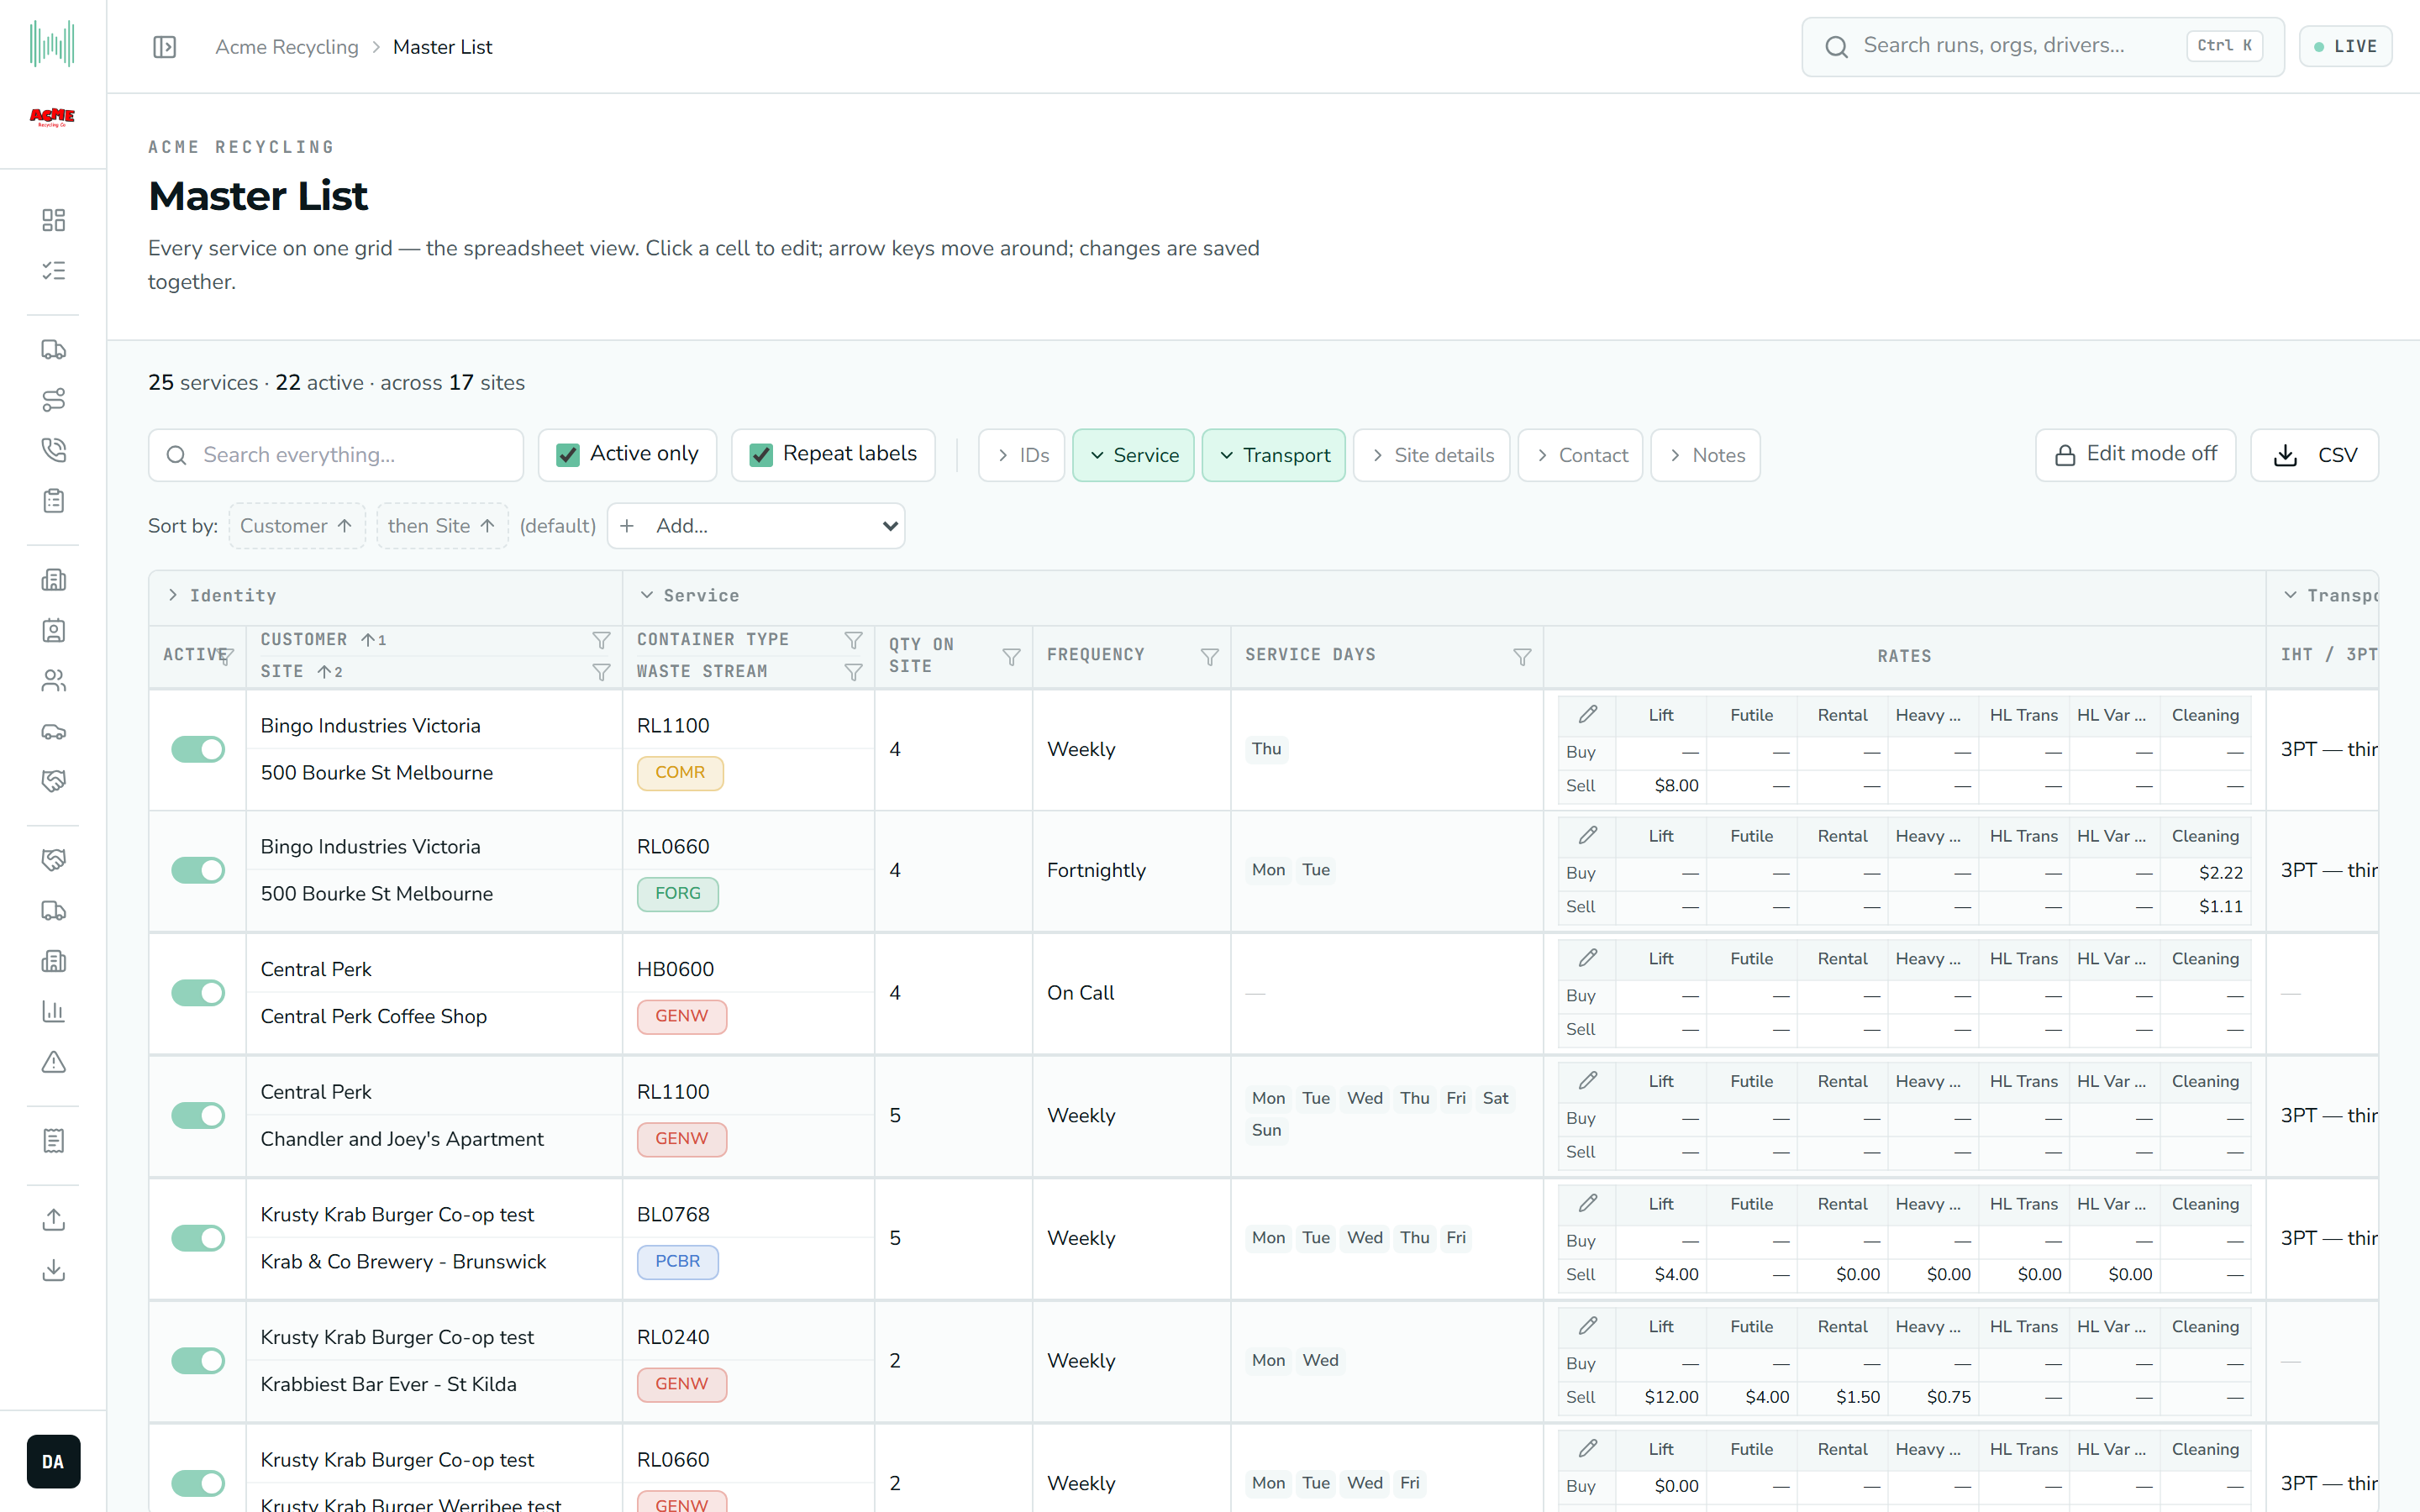
The Master List puts every service in your organisation onto a single, editable grid — laid out like the big spreadsheet many operators keep alongside the app. It’s the place to see and change a lot of services at once, rather than opening them one by one.
When to use it (vs the Services screen)
The Services screen is best for looking at, or carefully editing, one service — it shows the full detail and pricing for that service on its own page.
Reach for the Master List when you’re working across many services at once: fixing a batch of records, filling in missing details, comparing settings down a column, or checking your whole book of work in one view. One row is one service (a site’s waste stream in a given container), and you edit values right in the cells, the way you would in a spreadsheet.
The column order and labels deliberately mirror the spreadsheet this screen replaces — each column even shows its original sheet letter — so anyone who knows the sheet can read the grid without relearning it.
Reading the grid
Columns are gathered into groups you can show or hide from the toolbar, so you only see the fields you’re working with:
| Group | What’s in it |
|---|---|
| Identity | Active toggle, Customer and Site (pinned to the left so they stay visible as you scroll). The raw WastePro IDs hide behind the group toggle. |
| Status | Whether the customer and the site are active, and whether either is on service stop. |
| Service | Container type, waste stream, quantity on site, frequency, service days, and the Rates panel. |
| Transport | In-house or third-party (IHT / 3PT), the subcontractor, vehicle type, and the route(s) the service runs on. |
| Site details | Address, suburb, state, site evaluation link. |
| Contact | The site’s collection-day contact email and phone. |
| Notes | Site notes and the service note. |
The Status group is the quickest answer to “why isn’t this site generating jobs?”. A service can be perfectly active while its site or its customer is switched off or on service stop — and here you can see all four states on one row, and switch the customer or site ones straight from the grid.
The Customer and Site columns are frozen to the left edge, so they stay in view as you scroll sideways through the wider columns.
Some columns are read-only by design — routes, the site contact details, and the notes are shown from elsewhere in the app so you have the context, but they’re edited on their own screens, not here.
Finding what you need
The grid is built for slicing a large list down quickly:
- Search everything — the box at the top matches across customer, site, stream, driver, address, suburb, contact and notes at once.
- Active only — on by default, so you’re not wading through cancelled services. Turn it off to see everything.
- Sort by clicking a column heading; it cycles ascending, descending, then off. Click a second heading to sort by more than one column at a time — the Sort by bar shows the order and lets you flip or remove each one. The default is Customer, then Site.
- Filter a column with the funnel icon in its heading. Text columns get a “contains” box; list columns (stream, frequency, days, yes/no) give you a checklist of their actual values with counts. Active filters are listed in a Filtered bar you can clear from.
- Resize a column by dragging its right-hand edge, and repeat labels on or off switches the Customer and Site names between showing on every row and showing once per group (like merged cells in a spreadsheet).
- CSV exports exactly what you’re looking at — current columns, current filters and sort — to a spreadsheet file.
Editing — turn on Edit mode first
The grid opens read-only. To change anything, click Edit mode in the toolbar (you only see this if you have edit permission). Then work as you would in a spreadsheet:
Click a cell and type
Click a cell to select it, then start typing, or press Enter / F2 to open it. Arrow keys and Tab move between cells. For yes/no cells like Active, press the space bar or click the toggle. Drop-down cells (stream, container, frequency) open a picker.
Changes are staged, not saved yet
Every edit is held as a draft and highlighted, so nothing is written to the live records as you type. A counter at the bottom keeps a running total of unsaved changes and how many rows they touch. Each changed row gets a small undo control to revert just that row, or you can Discard everything.
Save them all together
When you’re happy, click Save changes to write the whole batch at once. That’s the point where the edits become live.
A few fields belong to the site, not the single service — the address, suburb, state and site evaluation link. Editing one of those changes it for every service at that site at once, since they all share the one site. That’s intended, but worth knowing before you edit.
Editing rates
Rates aren’t typed into the main grid. Each row carries a compact Rates panel showing buy and sell prices across the rate types (lift, futile, rental, heavy bin, and so on). Click the pencil in that panel to open the rate editor for that service.
Rate editing has its own permission, separate from editing the rest of the grid — so you might be able to change service details but only view rates, or the reverse. If the pencil only lets you look, that’s why.
Things worth knowing
- A service set to 3PT (third-party / subcontracted) with no subcontractor chosen is flagged Needs subcontractor in the grid — someone hauls it, but the record doesn’t say who. It’s a prompt to fill that in.
- Very large lists load the first 4,000 services; if you see a note saying so, narrow the search or filters to reach the rest.
- If the whole grid is read-only and there’s no Edit mode button, you either don’t have edit permission for this organisation, or writes are switched off in this environment.
Editing the customer active, site active or on stop columns changes those records for every service beneath them, so the grid asks you to confirm first and shows what else it will switch off — the same check you get on the customer and site pages. See Customers, Sites & Services.
Next: to review and model price increases across your services before they go live, see the Uprate Worksheet.