Driver Productivity
Driver Productivity ranks your in-house drivers by how profitable and productive they are over a chosen period. It turns each driver’s runs into revenue, cost, tonnes and per-hour rates, so you can see who’s carrying the load and where money is leaking.
You’ll find it under Analytics › Transport (IHT), listed as Driver Productivity Analysis.
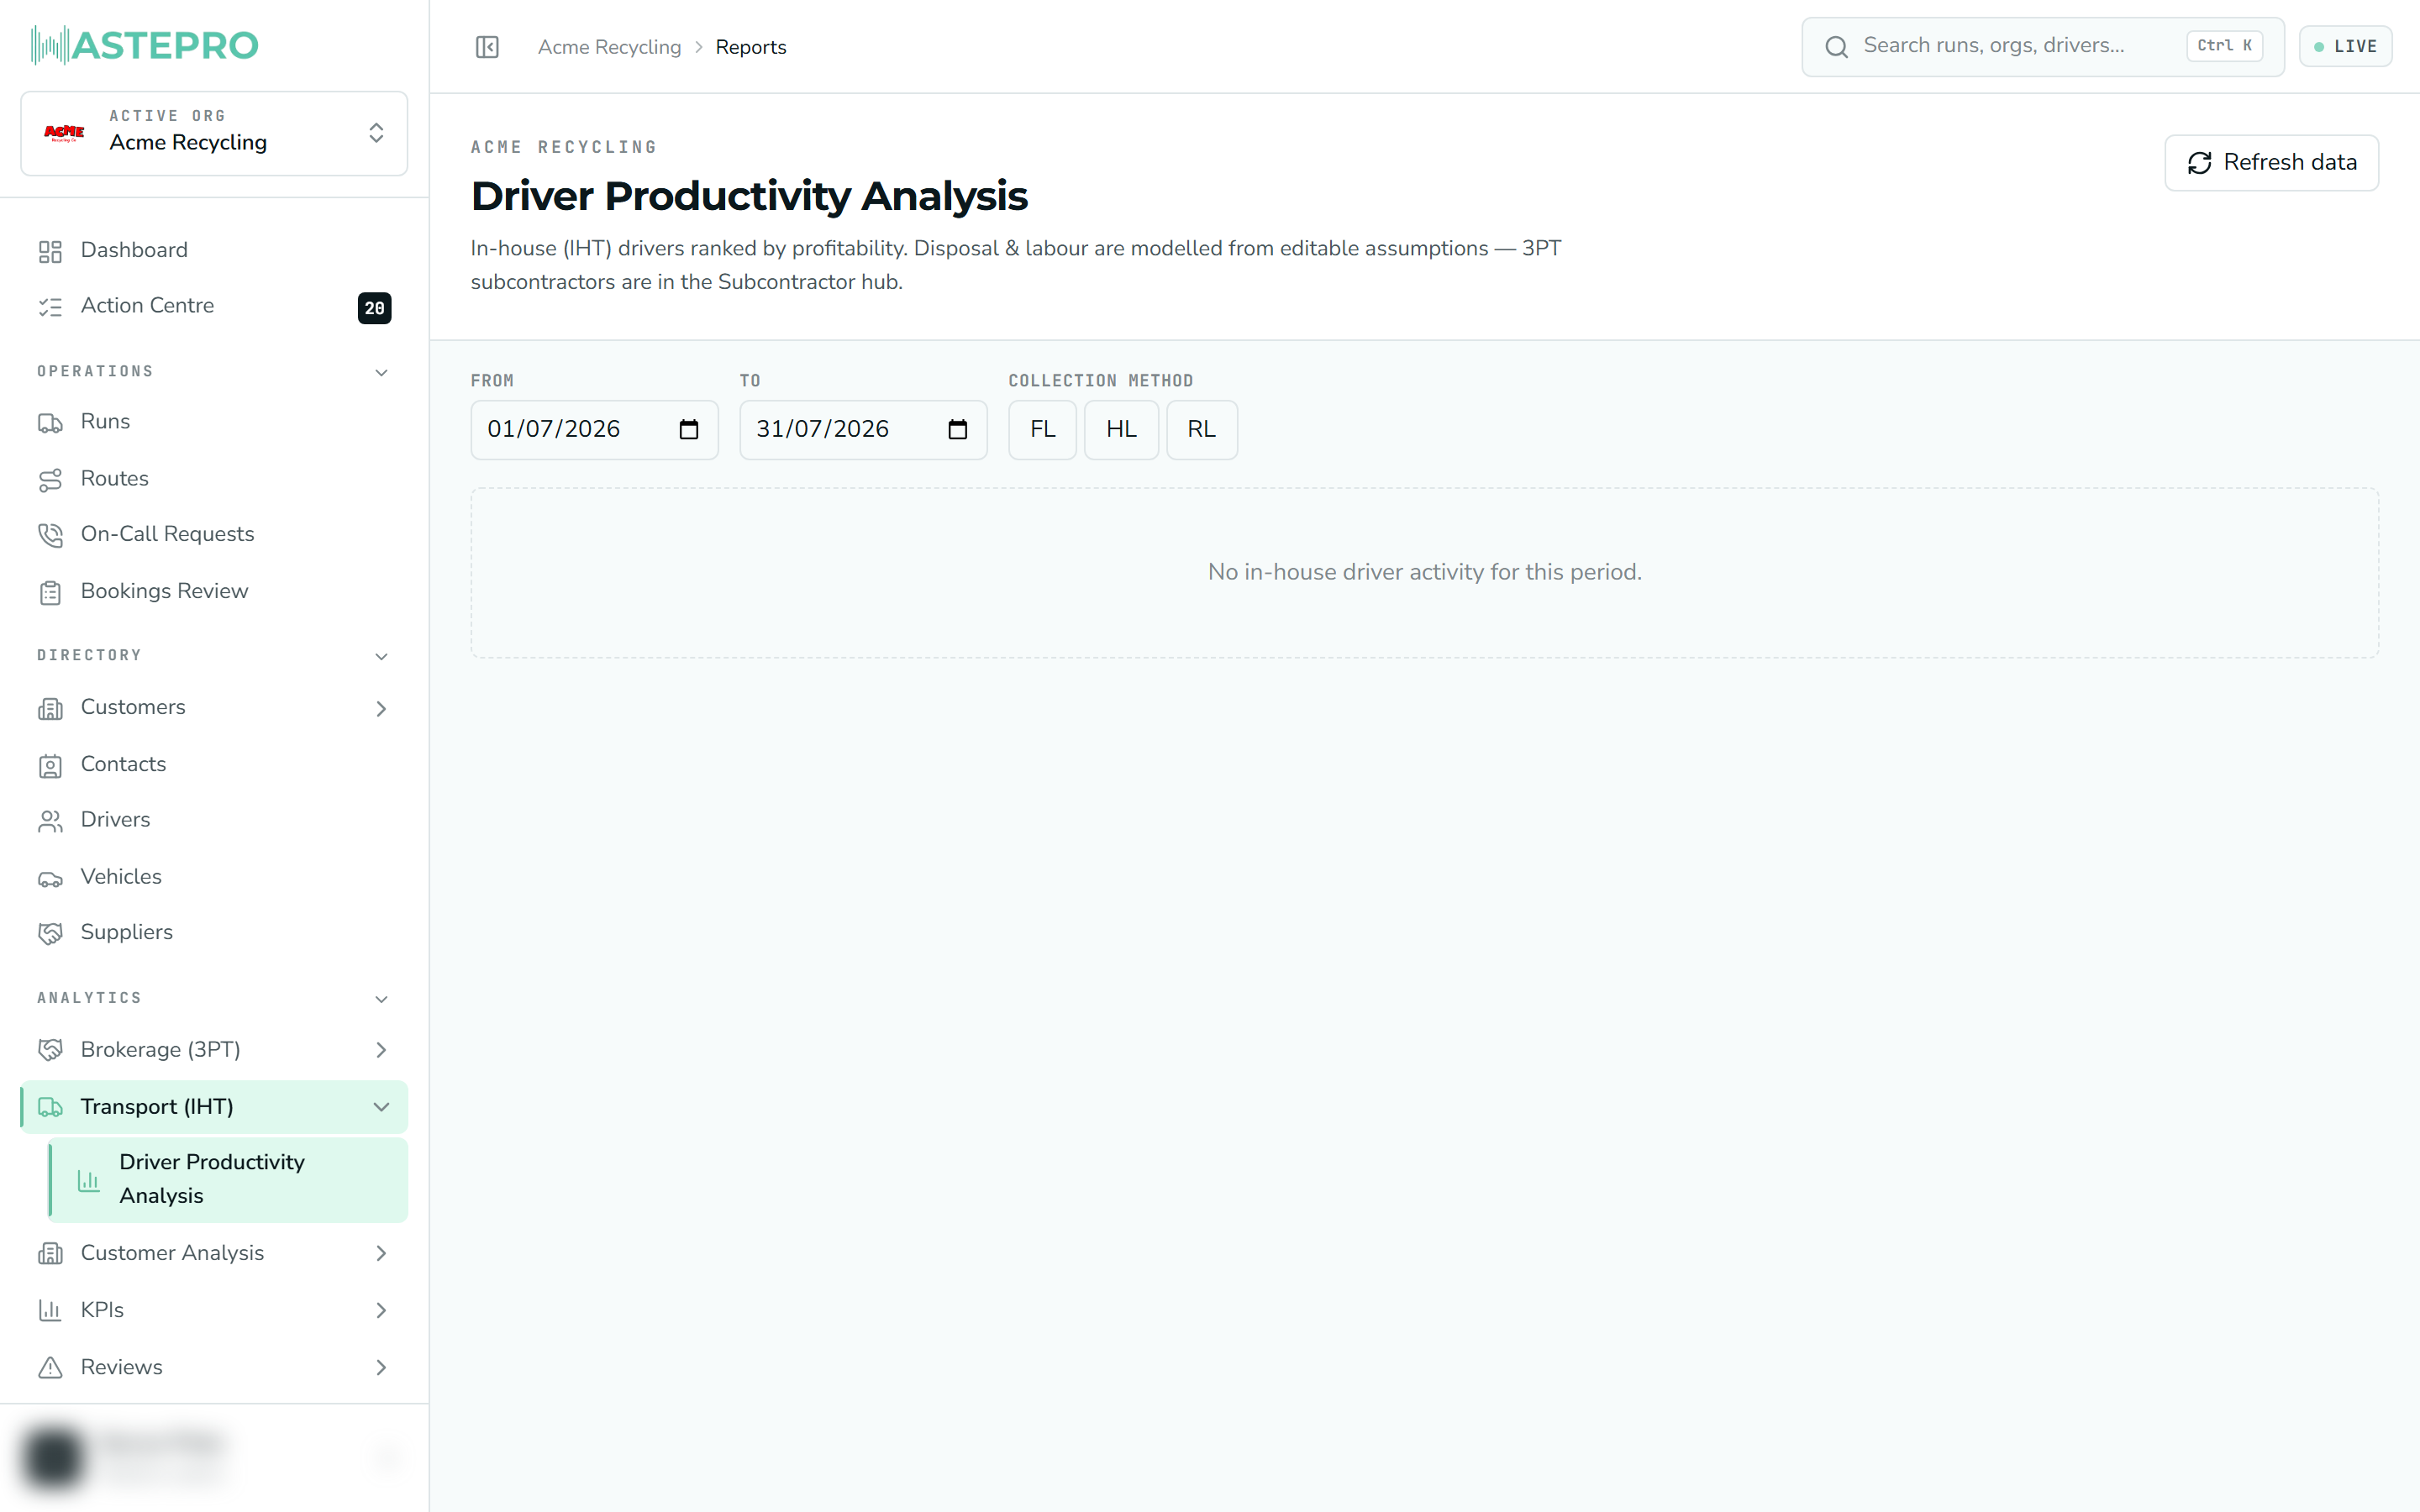
This report covers your own (in-house) drivers only. Subcontractors (3PT) are measured separately in the Subcontractor hub, not here.
Setting the period
Two controls sit above the board:
- Date range (from / to) — defaults to the current month.
- Collection method — buttons for FL (Front Lift), HL (Hook Lift) and RL (Rear Lift). Switch one or more on to focus on that kind of work; leave them all off to include everything.
Like the rest of the reports, this screen is read-only — see How reports work for the general idea.
The headline numbers
A row of cards summarises the whole team for the period, each with a small trend line and a change against the previous period: Revenue, Disposal (cost), Net Revenue, Labour (cost), Gross Margin, Tonnes and Volume.
Disposal and labour aren’t invoiced figures — they’re modelled from cost assumptions (a driver hourly rate, and a disposal rate per tonne per stream). Those live in Assumption Base, and changing them here changes what every driver’s cost and margin look like.
The leaderboard
Below the cards, every driver is a row, sorted by lift revenue by default. Click any column heading to re-sort. The main columns:
| Column | What it means |
|---|---|
| Flags | Warning badges (see below) |
| Lift Rev | Revenue from the lifts done |
| Disposal / Labour | Modelled costs |
| Net Rev / Margin / Margin % | Revenue after disposal, then after labour |
| Tonnes / Vol m³ / Hrs / Lifts / Stops | The raw workload |
| M³/Hr, Lifts/Hr, Stops/Hr, Rev/Hr | Productivity rates per driving hour |
| Avg Lift L, Lifts/Stop, Ltr/Stop, Min/Stop | Averages per lift and per stop |
| Longest gap / Avg gap | Idle time between stops |
A total row is pinned at the bottom, and clicking a driver expands their runs so you can see the same figures for each individual run that made up their total.
Flags and filtering
Drivers pick up flags when something looks off — for example a thin margin, unusually slow stops, long idle gaps, or lifts with no price or mismatched data. The thresholds behind these come from your assumptions. Use the Only flagged button to hide everyone who looks fine and concentrate on the exceptions.
Why some rates are blank
Per-hour rates and labour cost need a run’s start and finish times to be recorded. A banner tells you how many runs had usable times, and Show runs missing time lists the drivers whose runs are missing them.
Totals like revenue, tonnes, lifts and stops include every run. But the per-hour rates and labour cost only count runs that have start/finish times. If a driver’s hours look low or their per-hour figures are blank, it usually means their run times weren’t captured — not that they did no work.
Next: the cost rates and flag thresholds behind this report are set in Assumption Base.